| Earthquake
Booms, Seneca Guns, and Other Sounds
Introduction
& Basics
Earthquake "booms" have been
reported for a long time, and they tend to occur
more in the Northeastern
US and along the East Coast. Of course, most
"booms" that people hear or
experience are actually some type of cultural
noise, such as some type
of explosion, a large vehicle going by, or
sometimes a sonic boom, but
there have been many reports of "booms" that
cannot be explained by man-made
sources. No one knows for sure, but scientists
speculate that these "booms"
are probably small shallow earthquakes that are
too small to be recorded,
but large enough to be felt by people nearby.
As it turns out....there are
many factors that contribute to the "sound' that
an earthquake makes. To
begin to understand these factors we have to
understand the different types
of waves, the speed they travel through the earth,
and the speed that sound
travels through the air. See this easy to
understand, detailed explanation.
Perhaps the best way to understand
earthquake sounds are from an actual experiment
that took place back in
the 80's in California by David Hill. Dr. Hill's
team recorded sounds that
came out of the earth (from nearby small
earthquakes between magnitude
2.0 and 3.0) and simultaneously measured the
arrival of the P wave on a
seismograph. Researchers also reported hearing a
sound before the S waves
were recorded; this turned out to be the arrival
of the P wave. See this
Alaska Science Forum article entitled "Earthquake
Waves Outrace Sound"
for a description of that experiment.
Observations
of Earthquake Sounds
Spokane,
Washington
The most recent documented earthquake
sounds were from a swarm of small earthquakes that
unnerved the city of
Spokane, WA in 2001. Many of the Spokane quakes
were definitely accompanied
by "booming sounds". The quakes in Spokane were
shallow, sometimes only
a mile or two deep. This probably contributed to
all the noise they made.
Higher-frequency vibrations make the booming
sound, and when quakes are
deeper, those vibrations are gone by the time they
reach the surface. Sometimes
the quakes boom even when no vibration is felt.
See the
Seattle Post-Intelligencer
Reporter article "A mysterious swarm of noisy
earthquake unnerves Spokane".
New Madrid,
Missouri
There are
accounts of "artillery"-like
sounds that were said to have occurred before or
during the New Madrid
earthquakes of 1811-1812.
SOURCE: USGS
Earthquake
Booms, Seneca Guns, and Other Sounds
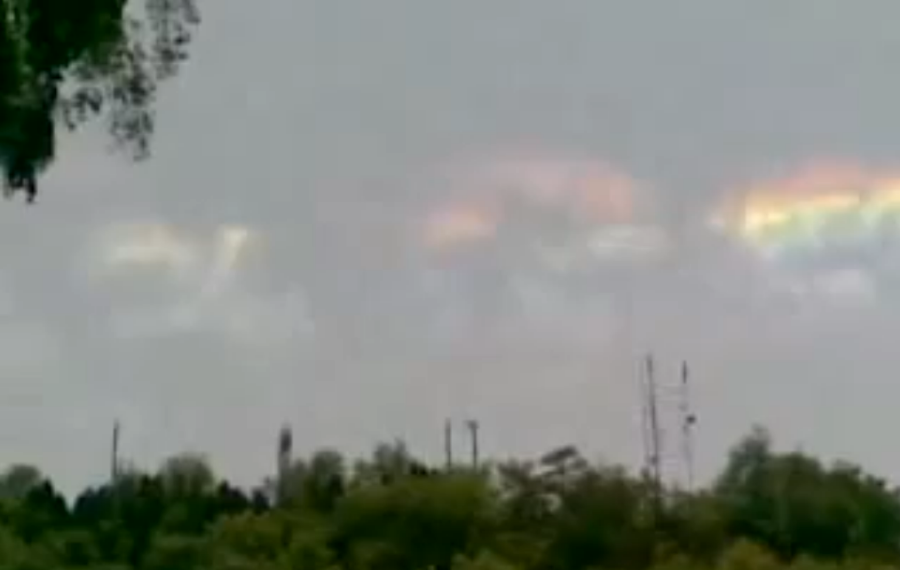
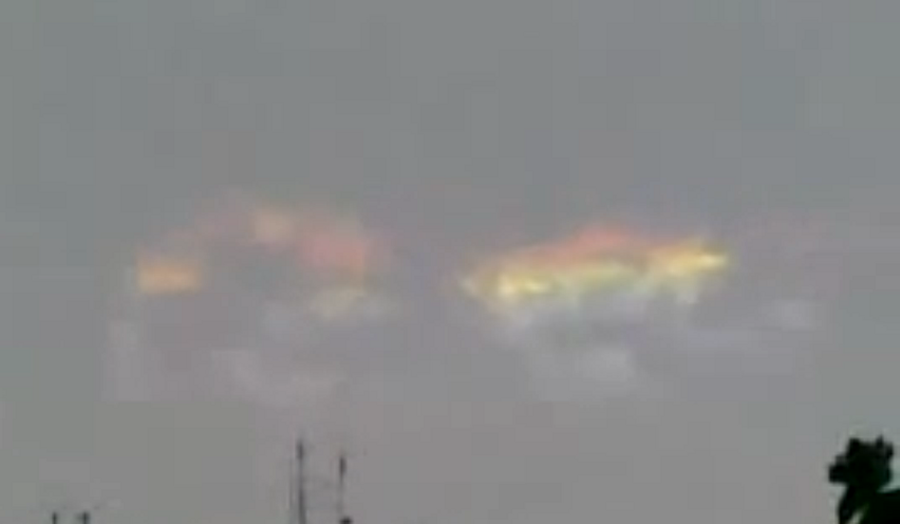
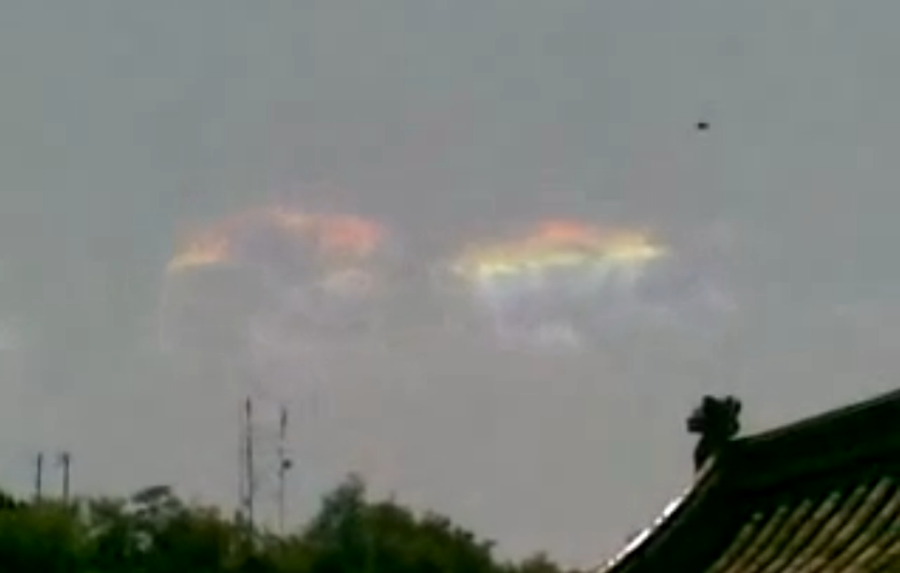
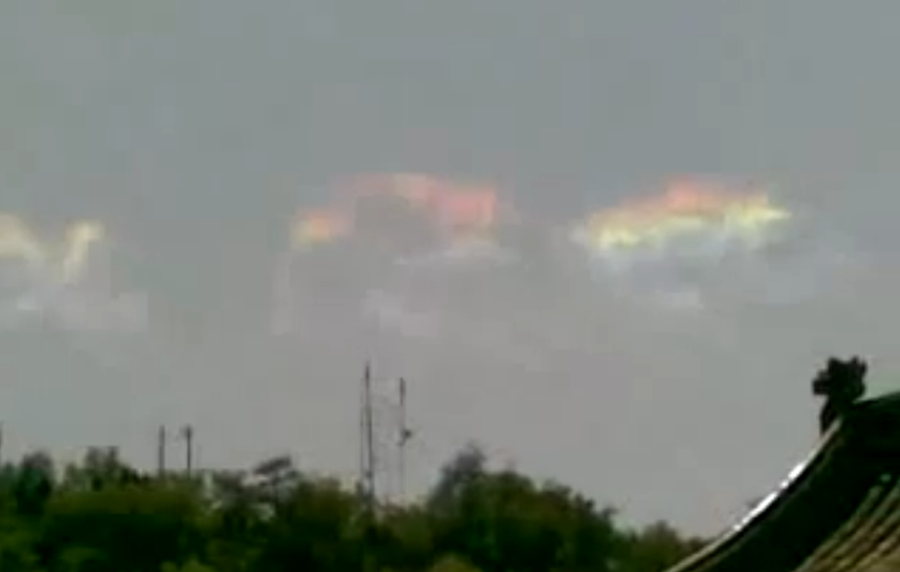
Earthquake
Lights
Magnitude 8.0
- Near the Coast
of Central Peru
Possible earthquake lights observed
at Lima
SOURCE: USGS
1930 07
23 Irpinia, Italy
41.05N 15.37E 1,404
6.5 Most of the damage was in the Ariano
Irpino-Melfi area of Avellino,
Potenza and Foggia Provinces. Damage occurred as
far away as Napoli (Naples).
The quake was felt from the Po Valley to Catanzaro
and Lecce Provinces.
Earthquake lights were
reported in the epicentral
area.
SOURCE: USGS
1962 09
01 Bu'in Zahra,
Qazvin, Iran
35.6N 49.9E
12,225 7.1 Ninety-one
villages destroyed and 233 damaged - over 21,000
houses destroyed, nearly
all built of poor-quality materials. Slight damage
at Tehran. Felt as far
away as Tabriz, Esfahan and Yazd. Based on damage to
old structures, this
was probably the largest earthquake in this
immediate area since at least
1630. Surface faulting with small offsets occurred
in a 100-km (63-mi)
east-west zone of the Ipak Fault. Some landslides
and sandblows occurred.
Earthquake lights (a red to
orange glow) from
the Rudak area were observed prior to the quake by
various people.
SOURCE: USGS
Feb 1991
Southern Xinjiang, China
25
14:30:27.6 40.386
78.959
21 D 5.5 6.1 1.0 289 Southern Xinjiang, China.
Mo=1.3*10**18 Nm (HRV).
Three people were injured and at least 120 houses
collapsed an 8,441 houses
damaged in the Kalpin area. Ground cracks and earthquake
lights were reported in the epicentral area.
Felt at Akqi, Aksu,
Bachu and Wasi.
SOURCE: USGS
Nov 15, 2004
West Coast of Colombia
NOV 15 09 06
56.5 4.695 N
77.508 W 15 G 7.2 0.9
708 near the
West Coast of Colombia. MW 7.2 (GS), 7.2 (HRV). mb
6.6 (GS). MS 7.1 (GS).
ME 7.4 (GS). Mo 7.6*10**19 Nm (HRV), 6.6*10**19 Nm
(GS), 4.6*10**19 Nm
(PPT). Es 2.8*10**15 Nm (GS). Two people seriously
injured, four others
slightly injured, at least 154 buildings destroyed
and 290 damaged in Bajo
Baudo. Seven people injured and at least 67 houses
destroyed or damaged
at Buenaventura. One person injured and some
buildings damaged at Cerrito.
Buildings damaged at El Cairo, Jamundi and Restrepo.
Some damage and power
and telephone service interrupted at Cali. Power
interrupted at Bogota.
Felt at Armenia, Quibdo and in much of western and
central Colombia. Felt
lightly by people in tall buildings at Quito,
Ecuador. Earthquake
lights observed in the area.
SOURCE: USGS
November 29,
1975 Kalapana Earthquake
During and
immediately after the main shock, 'earthquake
lights' of white to bluish flashes or glows lasting
several seconds were
reported by a number of observers. Earthquake lights
are associated with
major earthquakes and have been observed in Japan
and California. The lights
are believed to be results of earthquake-induced
distortions of the atmosphere.
SOURCE: USGS
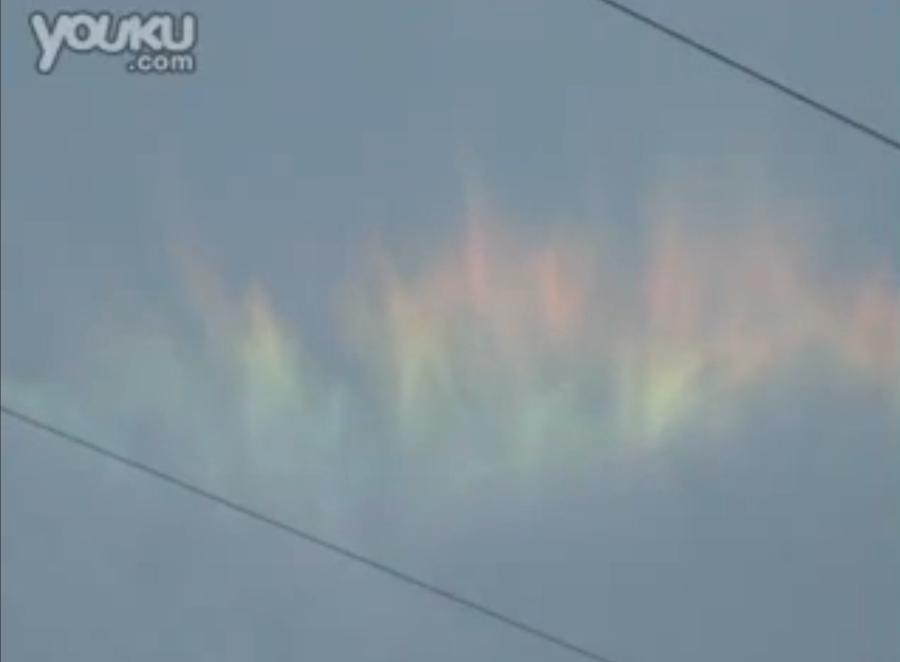
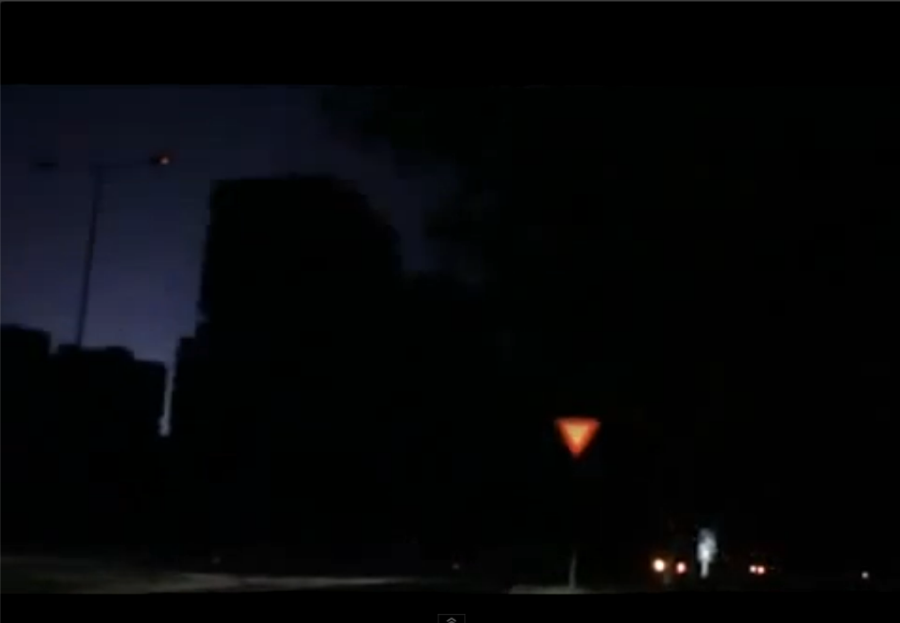
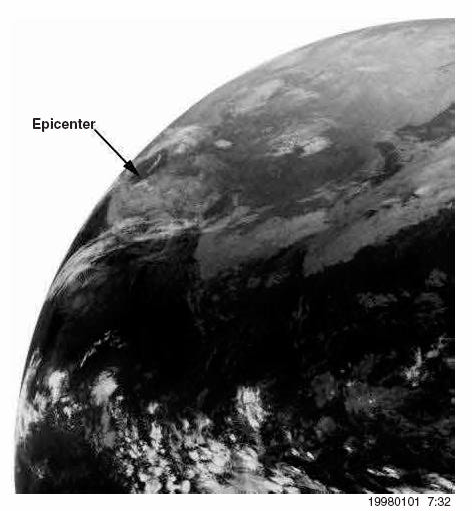
Glowing lights
around an earthquake's
epicentre
February 27
2008 - Market Rasen,
Lincolnshire, UK
One witness described how a
grapefruit-sized
glowing sphere appeared in her bedroom and then
went out like a light.
“This thing seemed to be coming across the room
straight at me. I was very
frightened,” she told the Louth Leader. Another
person described flashes
like car headlights at her window, and others
spoke of lightning flashes
after the quake. However, there was no lightning
activity at the time of
the quake.
Tangshan, China July 1976
People in Tangshan were awakened
one night in July 1976 by bright flashes in the
sky. Two days later an
earthquake registering 7.8 on the Richter scale
killed 240,000 people and
destroyed the city.
Matsushiro, Japan 1965-67
A Japanese scientist took photographs
of balls of light and red streaks in the sky
during a swarm of earthquakes
in Matsushiro between 1965 and 1967.
One explanation for his phenomenon
is that the electrical properties of rocks may
change under severe stress
before or during a quake. This may generate
changes in the electrical behaviour
of the atmosphere, ionising the air and producing
glowing lights.
Source Glowing
lights around an earthquake's epicentre -
February 27 2008 - The Sunday
Times
|