|
|
|||
|
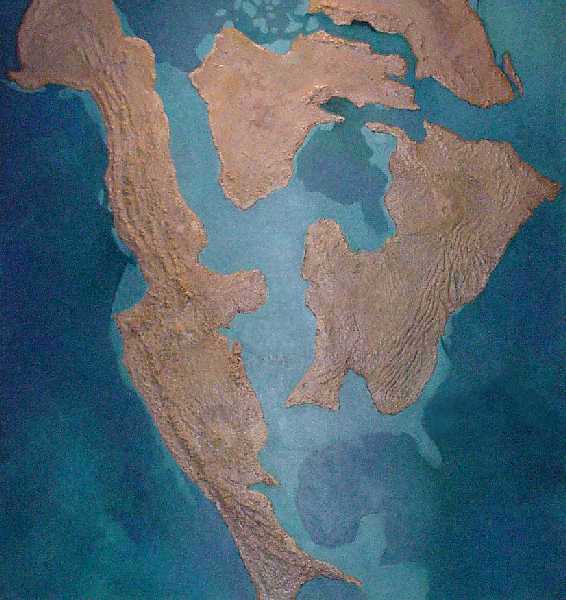
North America, Cretaceous ..
University of Nebraska State
Museum
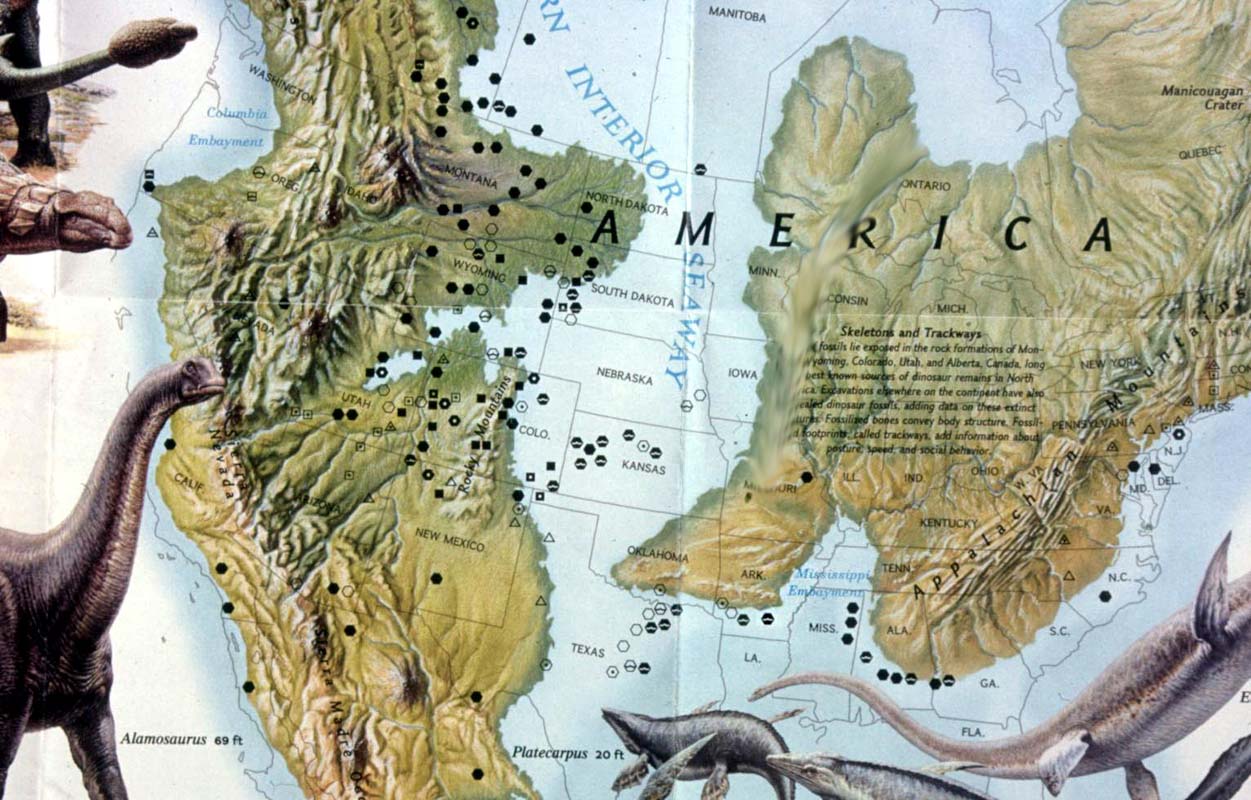
The museum has a wonderful, large scale map of North America during the late Cretaceous. Note that the shorelines of the Western Interior Seaway changed almost continuously as sea levels went up and down, and the western half of North America was pushed upward by the collision of continental plates. SOURCE: http://www.oceansofkansas.com/UNSM.html
..
|
|||
|
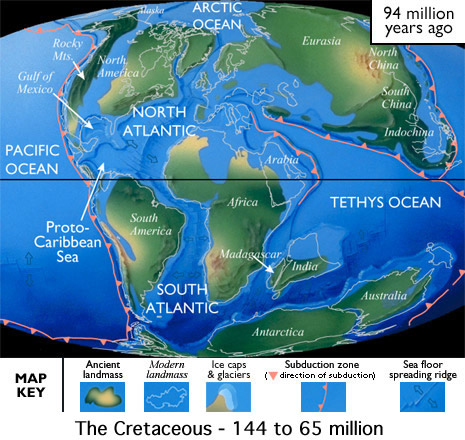
Ancient Sea levels North America, Jurassic ..
Sedimentary Rocks Excerpt: All the Paleozoic periods should be known now: Time Scale As was mentioned in the introduction, one of the distinctive
features sedimentary rocks is that they are stratified or "layered". Sedimentary
rocks are formed through a special sequence of events. the products of
weathering are the typical materials from which sedimentary rocks are made,
that is ions in solution, clay minerals and resistant minerals or unweathered
fragments. These materials are eroded, transported, and sedimented. They
are transported by mainly by rivers, but also by the wind, waves, currents,
glaciers, gravity (mudflows, landslides), etc. Then they are compacted,
dehydrated and often cemented.
The environment of sedimentation can usually be determined. Sediments are deposited in a variety of depositional environments such as river channels, flood plains, deltas, sand dunes & alluvial fans as well as lakes, swamps and estuaries. Marine environments include beaches, shallow marine, deep marine, reefs, bays SOURCE: http://www.alancolville.com/sediments.html
|
|||
|
Melting Anomalies on Greenland in 2007 ..
The year 2007 marked an overall rise in the summertime melting trend over the highest altitudes of the Greenland ice sheet. Melting in areas above 2,000 meters (about 6,560 feet) rose 150 percent above the long-term average, with melting occurring on 25-30 more days in 2007 than the average in the previous 19 years. This image shows the Greenland melt anomaly, measured as the difference between the number of days on which melting occurred in 2007 compared to the average annual melting days from 1988-2006. The areas with the highest amounts of additional melt days appear in red, and areas with below-average melt days appear in blue. Although faint streaks of blue appear along the coastlines, namely in northwestern and southeastern Greenland, red and orange predominate, especially in the south. This image is based on microwave-frequency data from the Special Sensor Microwave/Imager (SSM/I) on the Defense Meteorological Satellite Program. Snow and ice naturally emit microwave energy, but the signal is very different for dry versus wet snow. These differences allow sensors to detect the presence of melting snow on the surface of the ice sheet as well as deeper in the snow and ice pack. In addition to calculating Greenlands melting day anomaly, Marco Tedesco, a research scientist at the Joint Center for Earth Systems Technology, also calculated a melting indexa scale created by multiplying the number of days that melting took place by the area where melting occurred. Melting index in April and May of 2007 in high-altitude areas was very low, but in June melting jumped unexpectedly and remained high for the rest of the summer. The melting index in lower altitude areas of Greenland in 2007 was also higher than average by 30 percent, though it did not break any record. Over the entire sheet, the year 2007 fell at fifth place for the highest melting index on record, after 2005, 2002, 1998 and 2004. Increasing melting snow over Greenland can influence the Earth in several ways. Aside from contributing to direct sea level rise, meltingespecially along the coastcan speed up glaciers since the meltwater can percolate down to the ice-bedrock interface, acting as a lubricant between the ice and the bedrock. The faster glaciers flow, the more water enters the ocean and the greater the potential for sea level rise. Although some of the snow melting at high elevations is unlikely to reach the ocean, melting snow at high altitudes can still affect Earths energy budget. Melted and refrozen snow can absorb up to four times more energy than fresh, unthawed snow. As a result, snow melt can change the amount of solar radiation the Earth absorbs versus the amount it reflects. Further Reading:
SOURCE: NASA Earth Observatory |
|||
|
Greenlands Ice Island Alarm ..
What would large-scale ice loss on Greenland mean to
the rest of the world? Things weve come to count on could change, he
explains. Coastlines will recede as sea level rises and ocean water edges
inland, threatening coastal cities. The changing ice could impact ocean
and atmospheric circulation patterns and the global climate to which life
today has adapted. What will be the nature and impact of these changes?
Abdalatis answer: While the future impacts of the changing ice cover
are uncertain, the potential effects are scary enough so that we better
figure it out.
SOURCE: NASA Earth Observatory |
|||
|
Melting Ice in Antarctica ..
In places, Antarcticas rugged, coastal mountain ranges just barely break the surface of a sea of snow and ice thousands of feet thick. On its high, inland plateau sits a sheet of ice more than a mile thick. Massive ice shelves hang off the continents into the freezing sea. Even in the summer, most of the continent stays below zero. But even the coldest continent on Earth is melting, say NASA scientists. These maps illustrate different aspects of seasonal melting on the continent. After analyzing 20 years of satellite data, scientists have concluded that persistent meltingmelting that lasts for at least three daytime periods or one consecutive day and nighthas been occurring increasingly farther inland and at higher altitudes over the past two decades. The top map shows how the area affected by persistent melting has expanded since 1987. The colors represent the first year in which satellites observed persistent melting. Light green shows areas where melting was observed from the beginning, while blue shows areas where melting occurred for the first time more recently. The bottom map shows the number of days on which melting occurred in 2005, a year of particularly dramatic melting. Snow melted as far inland as 500 miles and at altitudes of 1.2 miles above sea level. Not surprisingly, melting lasted longest (dark purple) on the Antarctic Peninsula, which stretches northward away from the continent. The Ross Ice Sheet and the land to its interior also experienced between 10-20 melting days in 2005. Although Antarctica is often shrouded in clouds and experiences months of complete darkness each year, satellites have been able to observe melting on the surface routinely using microwave-frequency observations. Photo-like images of the surface can only be captured in daylight and on clear days, but snow and ice emit microwave frequency energy that passes right through clouds, day and night. Even the smallest amount of liquid water in the snow changes the unique microwave signal given off by the snow, allowing scientists to map areas where the surface has melted. For more on this story, please read the full news article, NASA Researchers Find Snowmelt in Antarctica Creeping Inland. NASA images by Robert Simmon, based on data from Marco Tedesco. SOURCE: NASA Earth Observatory |
|||
| FAIR USE NOTICE: This page contains copyrighted material the use of which has not been specifically authorized by the copyright owner. Pegasus Research Consortium distributes this material without profit to those who have expressed a prior interest in receiving the included information for research and educational purposes. We believe this constitutes a fair use of any such copyrighted material as provided for in 17 U.S.C § 107. If you wish to use copyrighted material from this site for purposes of your own that go beyond fair use, you must obtain permission from the copyright owner. | |||
|
|

