Larsen B Ice Shelf Collapses
in Antarctica
..
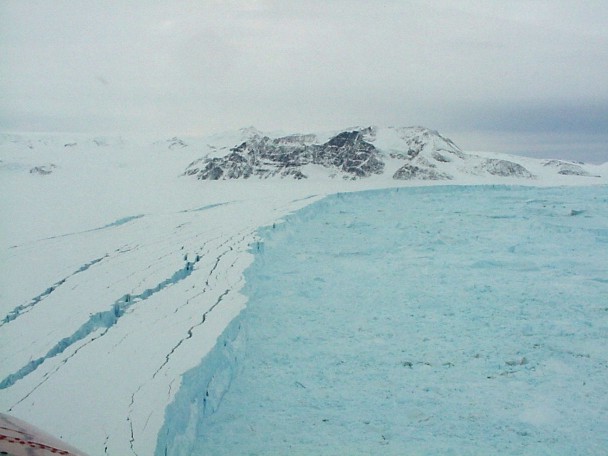
Photo courtesy of S.
Tojeiro, Fuerza Aerea Argentina, 13 March 2002.
Mapping the new ice front
line towards Cape Foyn. Edge parallel crevasses indicate future calving.
Posted: 18 March 2002
Updated: 21 March 2002 14:40 MST
SOURCE: http://nsidc.org/iceshelves/larsenb2002/
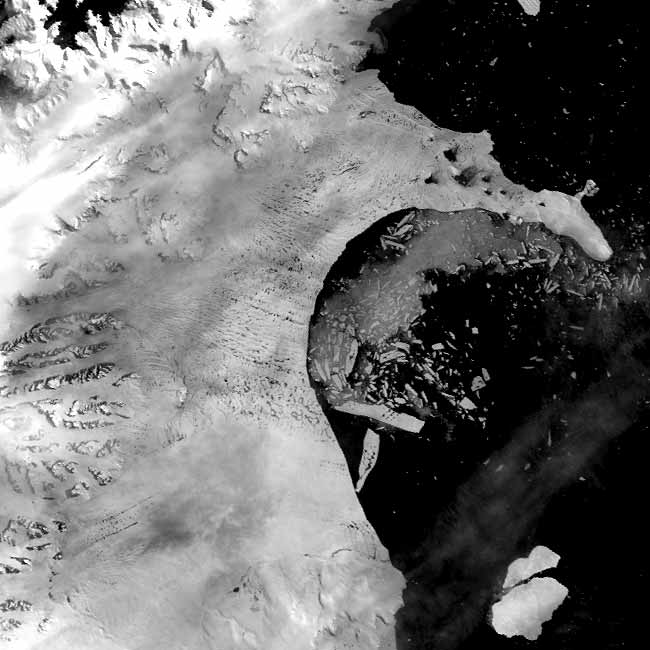
Recent Moderate Resolution Imaging Spectroradiometer
(MODIS) satellite imagery analyzed at the University of Colorado's National
Snow and Ice Data Center revealed that the northern section of the Larsen
B ice shelf, a large floating ice mass on the eastern side of the Antarctic
Peninsula, has shattered and separated from the continent. The shattered
ice formed a plume of thousands of icebergs adrift in the Weddell Sea.
A total of about 3,250 km2 of shelf area disintegrated in a
35-day period beginning on 31 January 2002. Over the last five years, the
shelf has lost a total of 5,700 km2, and is now about 40 percent
the size of its previous minimum stable extent.
Ice shelves are thick plates of ice, fed by glaciers,
that float on the ocean around much of Antarctica. The Larsen B shelf was
about 220 m thick. Based on studies of ice flow and sediment thickness
beneath the ice shelf, scientists believe that it existed for at least
400 years prior to this event, and likely existed since the end of the
last major glaciation 12,000 years ago (see
more about Dr. Eugene Domack's research).
For reference, the area lost in this most recent event
dwarfs Rhode Island (2717 km2) in size. In terms of volume,
the amount of ice released in this short time is 720 billion tons, enough
ice for about 12 trillion 10 kg bags.
This is the largest single event in a series of retreats
by ice shelves in the Peninsula over the last 30 years. The retreats are
attributed to a strong climate warming in the region. The rate of warming
is approximately 0.5 degrees Celsius per decade, and the trend has been
present since at least the late 1940s. Overall in the Peninsula, extent
of seven ice shelves has declined by a total of about 13,500 km2
since 1974. This value excludes areas that would be expected to calve under
stable conditions.
Ted Scambos, a researcher with the National Snow and
Ice Data Center (NSIDC) at University of Colorado, and a team of collaborating
investigators, developed a theory
of how the ice disintegrates. The theory is based on the presence of
ponded melt water on the surface in late summer as the climate has warmed
in the area. Meltwater acts to enhance fracturing of the shelf by filling
smaller cracks and forcing them through the thickness of the ice due to
the weight of the water. The idea was suggested in model form by other
researchers in the past (Weertman, 1973; Hughes, 1983); satellite images
have provided substantial observational proof that it is in fact the main
process responsible for the Peninsula shelf disintegrations. Christina
Hulbe of Portland State University and Mark Fahnestock of University of
Maryland collaborated with Scambos on the research.
A number of international scientists have also cooperated
in the general study of the demise of the shelves and the climatic trend
in the Antarctic Peninsula. As early as November of last year, Pedro Skvarca,
Head of the Glaciological Division of the Instituto Antártico Argentino,
warned of a possible impending breakup, due to very warm spring temperatures
and a dramatic 20 percent increase in the rate of flow of the ice shelf.
He and his team were the last people to set foot on the northern portion
of the shelf. Later in the summer, the Argentine group returned to their
base at Marambio, near the shelf, to await what they anticipated would
be the final disintegration event. They flew over the shelf repeatedly,
measuring its extent with GPS during the course of the breakup event. (See
Dr. Skvarca's photos of the ice
front line towards Cape Foyn and the broken
ice shelf south of the Seal Nunataks.)
A British research vessel, the RRS James Clark Ross,
was in the area just as the event was occurring and provided images
from the ocean surface in the region of the event. Keith Nicholls of
British Antarctic Survey (BAS) provided the images.
In prior studies, Dr. David Vaughan and Chris Doake
of BAS have reported extensively on the climate warming in the area, and
have modelled shelf stresses and possible causes of breakup. They collaborated
with Skvarca and with Austrian and German scientists, Dr. Helmut Rott and
Dr. Wolfgang Rack, who conducted detailed satellite radar image studies
and field studies in the area. The radar study also showed ice flow increase
in the years leading to breakup and an increased velocity of the glaciers
as the shelves disappeared. Radar images have provided very detalied views
of the events of past ice shelf collapses. Dr. Rott is a professor at the
Department of Meteorology and Geophysics at Innsbruck University; Dr. Rack
is now at Alfred Wegener Institute in Bremerhaven, Germany.
The melt water fracturing theory fared well in this
last event (See Christina
Hulbe's Larsen Ice Shelf site). Sequential images from the MODIS sensor,
a new satellite imager flying on NASA's Terra platform, showed extensive
melt ponding over the Larsen B in late January, consistent with an unusually
warm summer and extended melt season. In a series of images taken in February,
several of the melt ponds disappeared, presumably as they drained through
opening fractures in the ice. By 23 February, 790 km2 had shattered
from the front. The next image from 5 March showed another 1960 km2
of ice gone. The event continued to 7 March with an additional loss of
525 km2. The area lost by the shelf was was almost solely the
region covered by melt ponds in late January. The timing of the event,
at the end of a particularly warm summer, is consistent with the theory.
Images & Movies
View to the broken ice shelf
south of the Seal Nunataks.
Photo courtesy of Pedro Skvarca,
Instituto Antártico Argentino, 13 March 2002.
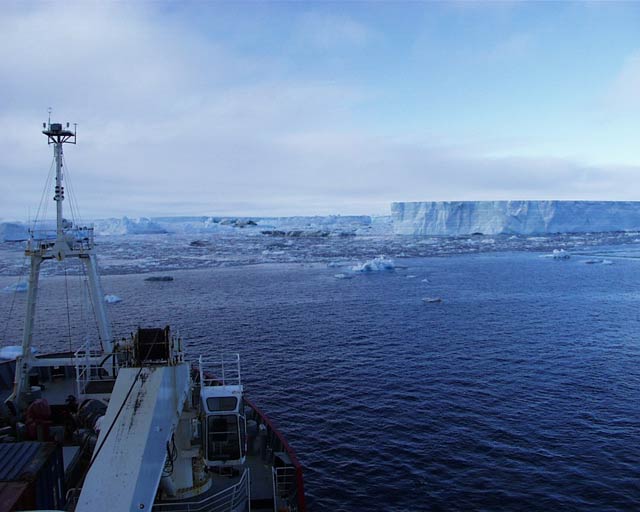
View of ice shelf from
research vessel.
Photo courtesy of Keith Nicholls,
British Antarctic Survey, 8 March 2002.

Animation of Larsen B breakup,
31 January to 7 March 2002
MODIS images from NASA's Terra
satellite, National Snow and Ice Data Center, University of Colorado, Boulder.
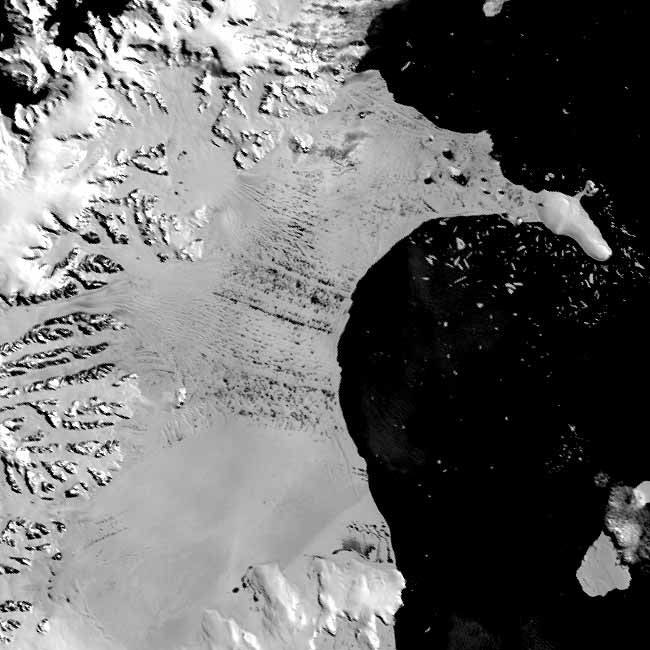
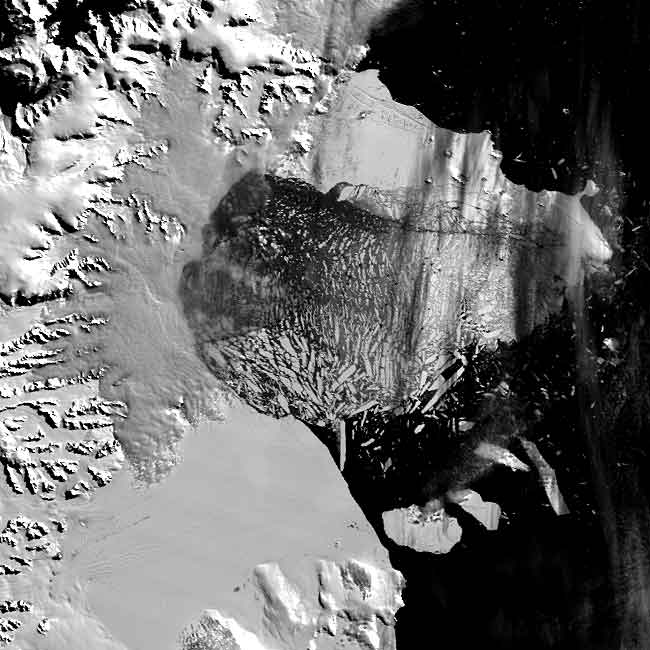
This is a true color animation
of the events of January, February, and March 2002 as recorded by NASA's
MODIS satellite sensor. (MODIS stands for Moderate Resolution Imaging Spectrometer,
a sensor flying on NASA's Terra satellite.) The images show the Larsen
B ice shelf and parts of the Antarctic Peninsula (on left). The first scene
from 31 January 2002 shows the shelf in late austral summer with dark bluish
melt ponds dotting its surface. In the next two scenes minor retreat takes
place, amounting to about 800 km2, during which time several of the melt
ponds well away from the ice front drain through new cracks within the
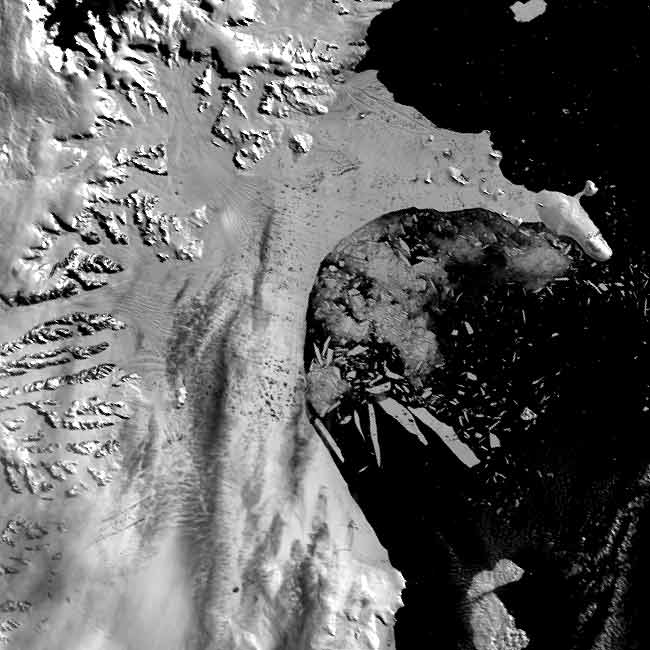
shelf. The main collapse is seen in the last two scenes, on 5 March and
7 March, with thousands of sliver icebergs and a large area of very finely
divided 'bergy bits' where the shelf formerly lay. Brownish streaks within
the floating chunks mark areas where rocks and morainal debris are exposed
from the former underside and interior of the shelf. The last phases of
the retreat totalled ~2600 km2.Resolution of the original images is 500
m.
View
animation (320 Kb) |
MODIS images from NASA's Terra
satellite, National Snow and Ice Data Center, University of Colorado, Boulder.
31 January 2002
17 February 2002
23 February 2002
05 March 2002
Other scientists, and Scambos, continue to look for
additional mechanisms that may contribute to the breakups. One idea is
that meltwater seeping between ice crystals and warming of the shelf as
a whole, reduces the fracture toughness of the ice so that the shelf shatters
under the same stresses imposed by local geography and the flow it used
to tolerate. Another idea is that meltwater seeps into shallow cracks and
expands the cracks as it refreezes during the winter. Ocean warming and
sub-ice currents dragging on the underside of the ice have also been cited
as possible contributors.
While the breakup of the ice shelves in the Peninsula
has little consequence for sea level rise, the breakup of other shelves
in the Antarctic could have a major effect on the rate of ice flow off
the continent. Ice shelves act as a buttress, or braking system, for glaciers.
Further, the shelves keep warmer marine air at a distance from the glaciers;
therefore, they moderate the amount of melting that occurs on the glaciers'
surfaces. Once their ice shelves are removed, the glaciers increase in
speed due to meltwater percolation and/or a reduction of braking forces,
and they may begin to dump more ice into the ocean than they gather as
snow in their catchments. Glacier ice speed increases are already observed
in Peninsula areas where ice shelves disintegrated in prior years.
With the Peninsula shelf breakups as a guide, we can
now reassess the stability of ice shelves around the rest of the Antarctic
continent. Past assessments of stability were based primarily on mean annual
temperature; with this guideline, most shelves outside the Peninsula were
considered well within their climate limit. Given the success of the melt
pond theory, we use the climate conditions and physical parameters of ice
shelves at the point of ponding as a guide in this assessment. In particular,
the next shelf to the south, the Larsen C, is very near the stability limit,
and may start to recede in the coming decade if the warming trend continues.
Melt ponds are occasionally observed in limited regions of the Larsen C
shelf. More importantly, the warmest part of the giant Ross Ice Shelf is
in fact only a few degrees too cool in summer presently to undergo the
same kind of retreat process. The Ross Ice Shelf is the main outlet for
several major glaciers draining the West Antarctic Ice Sheet, which contains
the equivalent of 5 m of sea level rise in its above-sea-level ice.
Although several recent large iceberg calving events
have been observed on the Ross and elsewhere in Antarctica, none of these
are thought to be related to ice shelf instability. |